Saturday, 24 December 2011

Ontario Electricity Act Being Re-Written - and Other Thoughts for Santa

I stumbled across something yesterday that jolted me away from Christmas planning.  I've not posted much this month as I've been suffering from writer's block in attempting to write Santa my list.  I don't wish  for stuff anymore - I generally mix up the old gift holiday with my murky religious philosophy. It's a season where a muddled mind is unavoidable - so I usually hope for wisdom.
For others
What attribute should I wish for this year?

I was thinking about this when I saw the CBC's Mike Crawley tweet:
At 4pm on Fri before Xmas, McGuinty govt announces proposed changes to how it reports on hydro debt retirement  

I clicked through the links and went right to the revisions in the act related to the Debt Retirement Charge (DRC).  I wrote on the Debt Retirement charge during Ontario's election campaign, and everything I said was confirmed by the Auditor-General long after the campaign.  To be blunt, the debt retirement charge is to pay off whatever amount the Minister of Finance says it is ... but our Minister of Finance is too contemptuous of the populace to provide a figure.
Anyway ... nothing I noted in the act differed from the existing act in terms of the DRC.

Returning to the non-evil Mke Crawley's tweets, there was an update:
Clarification of my previous tweet: govt official tells me hydro debt retirement posting  proposes no rule changes 
Hmmm ... so what is the update all about?
I did note the word "renewable" in the new act, a lot, and there is quite a bit about "smart meters" ... there's a lovely little bit on not discriminating on grid access followed, immediately, by a sentence noting "renewable' energy gets preferential grid access.  I think there is something in there on the government being able to raid OPG for funds at will too ... but I'm not a lawyer.

A third tweet followed from the non-despicalbe Mike Crawley:
Official says it kickstarts process for govt to report on status of hydro debt (as paid by debt retirement charge) as urged by auditor. 
Ahhhh - the act is to strengthen the larceny whereby public utilities have been stolen from Ontarians, with the wealth transferred to a "renewables' cabal (inclusive of the Mike Crawley I've emphasized the CBC's Mike Crawley is not). But it is to be pitched in the press as being related to accounting and the hydro debt.  That, and only that, explains the press release from Ontario's government being titled "Electricity Act, 1998: The Residual Stranded Debt and the Debt Retirement Charge"

My wandering mind wonders if there is anybody in the press who would attempt to find out what the changes are about when they are obviously not centred on what the government tells them to print.

Metro Martin, at the Toronto Star (Regg Cohn to dullards who don't see the resemblance to Bagdad Bob), provides an honest paragraph occassionally, and we were blessed with one of them this week in an article built around spending at the ORNGE air ambulance entity.
"Matthews says she was in the dark about ORNGE until, prodded by the Star’s coverage and the auditor general’s initial findings (his draft report has already been circulated), she demanded answers. In fact, opposition MPPs have been raising tough questions about the air ambulance arrangement for months without getting straight answers." 
Aside from the fact the auditor general had turned his sites on ORNGE, and the Star was most likely being provided facts to preemptively sacrifice heads to protect the inept McGuinty government, it's a refreshing piece of puffery to note The Star's chief propagandist is more important to the government than the people who voted for their representatives that sit in the legislature.
I wonder if the Globe's Mr. Chatelaine (A. Radwanski) will comment on the changes to the Electricity Act - I'm interested in his views on the choice of font.  While Metro Martin seems to choose to be uninterested in honest commentary at The Star, Radwanski is increasingly simply irrelevant.

When the Auditor-General's report was released, Radwanski tweeted his annoyance at it being treated as having any importance at all (a lock-up for this?) and then:
Quick take on the auditor's report: not too much new on green energy
Ignoring the criticism of the government's greeniness didn't seem to work, which Metro Martin picked up on right away.  His articles following the report's release went at the credibility of the critic in order to diminish the criticism, as he indignantly noted studies which cited job losses in other jurisdictions, mentioned briefly in the auditor's report, where discredited - and some studies have been rebutted, but our MM wouldn't know which ones, or whether the discrediting was valid.


The Globe's Mr. Chatelaine liked that angle.  He'd tweet: "Incidentally, I share others' surprise that the A-G cited controversial anti-green enegy studies - undermined his own work on the subject."


Santa - there's a wish for me and my peeps:  Can you get the Globe & Mail back to fulfilling the role Junius described:  "The subject who is truly loyal to the Chief Magistrate will neither advise nor submit to arbitrary measures."  In the coverage of Queen's Park, that would replace the role they have been playing lately - which is Newt to The Star's Herc.  It's been clear for awhile that the Globe's editorial endorsements will go to whoever they expect to win an election (and control a huge advertising budget - so I get that), but it would be nice to have some competence in between campaigns.


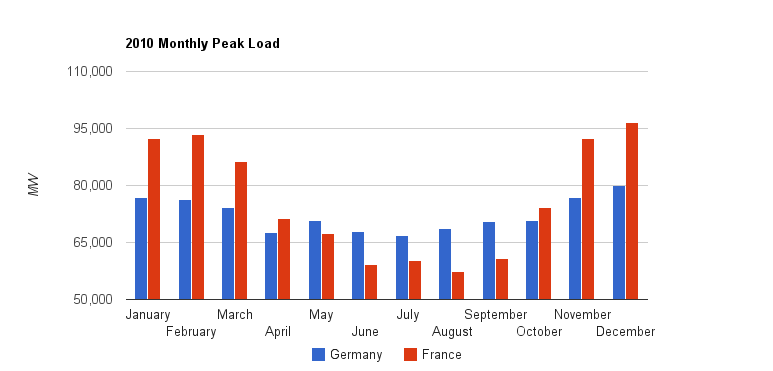
Well ... I've got tot get back to thinking about the children now.  Looking back at the year for niceness ... I don't think over half of eligible voters not turning up was very nice.  I don't think the collapse in Ontario's electricity market is nice - the ongoing huge contracts for unnecessary supply is not nice, the hidden contracts for new supply aren't nice, and the hidden agreements not to have new supply are less nice.  I don't think demand dropping off a cliff as the year ends is nice - and it's probably indicative of an industrial sector that is even less nice than pessimistic people realize.


Actually ... there seems to be a lot more naughtiness than niceness going on within the scope of this blog.


This year, my wish is for:
competence.
Not for me Santa - nice is not an adjective attached to me very often.
Not for me Santa, but for you.
Competence.
Do your job Santa.
Give us coal.


Tuesday, 13 December 2011

Kyoto a no-go: Canada exits

There's a lot of press, and commentary, on Canada's long-anticipated withdrawal from the Kyoto Protocol.
I've visited the International Energy Agency (IEA) site to grab a spreadsheet of CO2 Emissions from fuel combustion (the bulk of emissions), and done a couple of brief calculations to develop illustrations of why Canada exited Kyoto, and when we fell behind on our targets.

The Kyoto Protocol was signed in December of 1997.  It set a base year of 1990 - some would say because of the skill of negotiators from countries that didn't have growing GHG emission between 1990 and December 1997.  Especially countries with recovering eastern bloc ecosystems.


A look at the changes between 1990 and 1998 (essentially the difference between Kyoto's negotiation and it's retroactive base year) shows the decline of the overall Annex 1 parties, but a growth of 18% in Canada.

Between 1998 and 2009 (the final year of data in the IEA spreadsheet), Canada didn't perform much differently, although having a significant oil industry, we still had some growth.

Of particular note here, the United States emissions drop in this period, by 5%, while Annex 1 Kyoto parties decrease by only 2%!  The growth in emissions clearly shifts to the non-OECD region.

Much of the press has centred on how backwards our Prime Minister Harper is, so I'll conclude with the same graph, but for the period of only 2005-2009 (Harper was first elected PM in 2006), when the Non-OECD region grows to emit far more than OECD countries.


Monday, 12 December 2011

Secret Deals between Public Power in Ontario and Quebec


There have long been suspicions that Ontario has been dumping hydroelectric production.    Earlier this year a report indicated Americans were generating power with the Ontario water allocation we were unable to use.  As the year progressed and water levels of the great lakes remained well above 2010 levels, it became apparent that Ontario’s hydro levels were producing at new lows as the year progressed.  I reviewed generation figures by site for September, and noted a big drop in the output from the unregulated segment of the Ontario Power Generation (OPG)  Ottawa/St. Lawrence Plant Group .  I made inquiries as to whether the water sharing agreements from the Niagara River were mirrored for rivers shared with Quebec at the time, which went unanswered.  Now I believe I’ve stumbled upon the proof that we have agreements with Quebec resulting in exports, and generation, that are not being reported.


Ontario's Independent Electricity System Operator (IESO) is, in my opinion, the exemplary government organization in making data available.  As each day progresses, reports are available for hourly generation, by generator (only if they are a certain scale), and for each intertie connecting markets.  I've written on daily records based on these two files, because Ontario Demand should be all generation, plus imports, less exports.
But it isn't.

There are reasons these files don't yield 100% accuracy compared to the reporting the IESO puts out on a weekly basis, including not all generation being included - but there is a patterned variance most weeks.
For instance, the Intertie Schedule and Flow Report for October 7th, 2011 shows, for the first 4 hours, exports of 1969, 2431, 2369 and 2425MW.  The cumulative Import/Export Schedule shows, for the same times, shows 1533, 1995, 1933, and 1989.  The difference, of over 430MW throughout many off-peak hours, is patterned.  This difference is the historical figures reported, as having been exported, less the actual movement of electrons out of the province.


That pattern is matched by the variations in hourly output of the R. H. Saunders Hydroelectric facility.  Between 6 and 8 am on October 7th, Saunders production is shown as doubling from 397MW to 794MW.

Graphing the output of Saunders, as shown in the hourly output and capability report, stacked with the variance between the hourly intertie figure, and the export figures later reported, it is apparent that Saunders is actually generating at a fairly constant rate, but much of the output is diverted to, presumably, Quebec.  This particular week saw over 40000MW of production that was not reported as production, and 40000MW of exports not be reported as exports.  That is the highest I have seen since tracking the hourly intertie data in April 2011, but it is not unique.

Weekly Totals since April 2011
As Quebec demand ramps up entering winter, it appears their ability to alleviate Ontario's growing excess supply burden also grows.  As these transactions aren't even acknowledged, the benefits/costs are not known.  What is known, and included in the IESO's 18-Month Outlook, is that other actions are being taken to curtail production during the many period where generation exceeds demand.
"So far in 2011, nuclear units have been maneuvered 113 times for a total of 364 hours. Compared to 2010 which had nuclear units maneuvered 14 times for a total duration of 64 hours, this represents a significant increase. This rise in manual action is a result of a lower minimum demands as well as a growing portfolio of inflexible generation."
The secrecy shrouding the existence of agreements between Ontario and Quebec is somewhat bizarre considering strong support, within Ontario, for clean energy imports from Quebec.  Aside from Quebec having the exceptionally valuable asset of reservoir storage/generation, Quebec is also a winter peaking jurisdiction where Ontario is a summer peaking jurisdiction.   It makes perfect sense that Ontario's excess, largely in the shoulder seasons (although even this morning nuclear production was curtailed for a few hours), would be sent to Quebec.  What doesn't make sense is for Ontario's publicly owned OPG have a secret relationship with Quebec's publicly owned Hydro-Quebec.

Friday, Ontario's Ministry of Energy released their latest press release to mislead citizens about exports benefiting Ontario - as they have taken to doing every month.  These monthly creative writing assignments cite an IESO page listing monthly imports and exports.  The IESO page is a true accounting of their import/export methodology, but exports are 0.55TWh higher, since April 1st, than they indicate - the difference seemingly comprised of switching the flow of some of Saunders' turbines to Quebec's grid.  Not that it makes any difference to the Ministry of Energy, who stupidly cite revenues without any reference to costs - but the people paying about $73.47/MWh in Ontario, for November (estimates of $28.76 HOEP plus $44.71 GA), might like to know the net export revenues their government notes ($16.1 million) are attached to an admitted 584,496MWh net export ($27.55/MWh), and a hidden 132,490MWh.   For November, net exports are under-reported by over 20%!

The hidden exports may not be such a bad deal.  Capacity payments are increasingly a feature of electricity systems, and this may give Ontario preferential access to over 2000 MW of clean supply during summer peak periods.  But Ontarians deserve to know the deals that exist, and they deserve to know how much generation is being spilled, curtailed, exported, and simply shuttered, while the building spree, of additional generation, continues unabated.


Monday, 28 November 2011

A Dubious Distinction: Another Wind Record For Ontario

Sunday November 27th saw a record for hourly electricity production from Ontario's wind turbines.
Hour 10 has 1427MW recorded, which is 1MW higher than the 1426 recorded for hour 9 only two Sundays before.(endnote 1)  The day was also notable as mild temperatures further reduced Ontario's demand, which had already been trending down for the previous 6 weeks.


Comparing hourly production data from Sunday November 27th, 2011, to the production from Sunday, November 28th, 2010, and estimating hourly demand from intertie activity, shows that the additional wind generation of 20,119 MWh coincided with a drop in demand of approximately 38,365MWh of demand.(endnote 2)   That required over 58GWh  of other supply to be curtailed, or exported, which is essentially all production from natural gas and coal that occurred in 2010.  Cas and coal reductions were only about 25.6GWh, nuclear 22.1GWh, and exports were upped by 10.5GWh.


Nuclear Hydro Wind Gas Coal Other Ontario Demand Net Exports
2010 240,696 83,415 6,782 52,156 8,082 2,424 371,778 21,008
2011 218,610 81,907 26,901 29,280 5,242 3,046 333,413 31,573
Variance -22,086 -1,508 20,119 -22,876 -2,840 622 -38,365 10,565


The decreased natural gas output during the early hours of the day appears to have been bought by curtailing natural gas output from non-utility generators, which typically account for about 1000MW of supply, but dropped below 660MW as the day began, and didn't return above 1000MW until 11 am.  Two nights earlier, during similarly high wind production, reducing output was bought by curtailing Bruce Unit 8 (nuclear).  The Hourly Ontario Energy Price (HOEP) for the 27th averaged only $27.44/MWh, but dropped as low as -$13.51/MWH, with the 5 minute MCP price bottoming out at -$128.30/MWH.(endnote 3)

---
Over the 24 hours of November 27th, wind output was the 10th highest on record - the highest coming 2 weeks earlier, and 4 of the top 10 days being in November 2011.  Over the first 27 days of the month, wind turbines show as generating over 500GWh of electricity, which exceeds the previous monthly record (set in February), by a wide margin.  Increased monthly wind output has been more than offset by a reduction in the monthly production of nuclear energy - fossil fuels are relatively unchanged from 2010.  The trend in increasing events resulting in curtailing nuclear production was just emphasized in a report from the system operator: "So far in 2011, nuclear units have been maneuvered 113 times for a total of 364 hours. Compared to 2010 which had nuclear units maneuvered 14 times for a total duration of 64 hours, this represents a significant increase."

The impact of the supply curtailment impacts all customers, but the most immediate impact will be on wholesale market customers, and it will show in the increased Global Adjustment (GA), which is added to the market price in order to recover the full costs of generation (almost all of it being contracted).  The system operator first estimated November's GA would be $37.85/MWh.

I anticipate the 2nd estimate for the global adjustment, due by the end of the week, will be about $10/MWh higher than the first one.   If not for curtailed nuclear production, which avoided subsidizing additional exports, the Global Adjustment might also be setting a record this month.


Endnote 1:  That figure includes 4 locations that are not officially in service, and therefore seem to be reporting as 0 when the IESO produces it's weekly .csv file updates.
The previous record high, and still record daily volume, I noted here.
Prior to that, the record was Saturday, October 16th, which I noted here
Spreadsheet is here
Endnote 2:  not all production shows in the IESO hourly reporting, both for generation, and interties, so there will be some upward movement in 2011 demand when final figures are released
Endnote 3:  The IESO daily reporting is here.


Saturday, 26 November 2011

Perspective on Ontario's Electric System Operator 18-Month Outlook


On our American neighbour's Day of Thanksgiving, the Ontario's Independent Electric System Operator (IESO) released it's latest 18-Month Outlook, to May 2013.  The headline summary from the press release 
was that "Over the next 18 months Ontario will continue to have an adequate supply of electricity to meet consumers' needs."
That hasn't been an issue for years, and the present's premier problem was emphasized as the calendar changed over to the US Black Friday, the day American retailers allegedly move from the losses of the previous portion of the year to the profits of the holiday season. Ontario was paying $31.80/MWh to any market that would accept our exports, and, finding limited takers, Bruce Power was being forced to reduce output from it's nuclear units.  Between the 1100MW we found export markets for, and the 300MW we would pay Bruce to prevent the production of, the IESO managed to compensate for the inconveniently high wind output of  1413MW.

The report notes that 2 nuclear units at Bruce Power will be ready to provide power to the grid within the first 2 quarters of 2012, while the grid will be ready for Bruce Power to supply more power, maybe by the end of the fourth quarter of 2012.

The report notes concerns in the 'southwestern GTA.'  The southwestern GTA has shown to be totally unconcerned about that in driving away contracted supply - twice.  The IESO might be able to alleviate their concerns about supply in the southwestern GTA simply by moving their office out of the southwestern GTA.

Nobody outside of that area could care less.

Screen Capture from IESO 18-Month Outlook, Page 5
The supply changes for the next 18 months, shown in Table 4.2, are simply idiotic.  1000MW of generation capacity that can be varied to meet demand will be removed, and 1500MW of production that is most economical producing all the time will come online (although it is questionable when due to transmission issues), as will 450MW of wind generation that puts out for money, but only when it's in the mood to.
To be clear, the IESO doesn't plan the generation mix.  Politicians do.

Screen Capture from IESO 18-Month Outlook, Page 7
Table 4.4 shows the impact of wind on planning, as summer wind capacity factors (the percentage of capacity expected during the peak hours of the day), is around 13%, and in the winter its 33%.  Under the long-term energy plan's whimsical 7-8000MW of wind capacity, this equates to adding about 910MW of capacity for summer peaking, and 2310MW of winter capacity.  We are, of course, a summer peaking jurisdiction.

A couple of quick queries of data from 2009 on indicates to me that 25% of the time wind is under a 10% capacity factor during the peak demand hour of a January day, and 42% of the time during the peak demand hour of a July day.    I'm skeptical of the wisdom of planning on any wind capacity to be there when needed - unless you are planning on a cull during a cold spell.  Regardless... the plan is to add far more capacity in winter.

There is some concern about the impact, on the grid, of dropping demand in some sections.  For instance:
"The reduction in the load in the Northeast, and in particular at the Kidd Creek Metsite, has resulted in higher than acceptable voltages in the Timmins area. While the new SVC at Porcupine TS will help, additional reactive compensation is required to reduce the increasing dependence on the generating facilities in the Northeast to maintain voltages within acceptable ranges."
More money being spent due to the Xstrata's fleeing of Ontario's rising costs, on electricity and compliance with 'environmental' regulations, for the more business-friendly confines of Quebec.

Screen Capture from IESO 18-Month Outlook, Page 16
Figure 7.2.1 shows the contribution of wind generation at peak.
Oh look ...
It was almost always contributing more than the forecast planned.
The exceptions being the coldest period (peak winter demand came on January 24th) and hottest (peak on July 21st) periods of the year.

Not that it isn't doing precisely what it was intended to do.  The very last paragraph of the IESO outlook includes:
The other large variation seen from the previous year was the frequency by which a nuclear unit had to be either maneuvered or shut down. So far in 2011, nuclear units have been maneuvered 113 times for a total of 364 hours. Compared to 2010 which had nuclear units maneuvered 14 times for a total duration of 64 hours, this represents a significant increase. This rise in manual action is a result of a lower minimum demands as well as a growing portfolio of inflexible generation. The ability to dispatch renewable resources may help to mitigate the need for these actions moving forward,
The only thing wind can do is dislodge baseload supply:  the 10-fold increase in hours of bypassing supply from nuclear is precisely the intent.

Thursday, 24 November 2011

New Report Demonstrates The Market Impact of Renewable Energy Policies


The press release for the OntarioEnergy Board's Market Surveillance Panel (MSP) Monitoring Report on Ontario'sElectricity Markets  noted four recommendations, including: an increase in the frequency with which interties are scheduled, and the associated frequency of demand and intermittent generation forecasts as well as pre-dispatch schedules” and; "accelerating efforts to make wind generators dispatchable ...”  The MSP report's information supports the claims (argued previously here), that the depressed market prices, and dumping of excess generation, will not simply continue, but grow over the next decade if Ontario's supply procurement policies persist.

The Market Surveillance Panel (MSP) report delivers an analysis of “low-price” hours (defined as the Hourly Ontario Energy Price – or HOEP – being below $20/MWh).  In comparing the Ontario Energy Board (OEB) seasons, where winter begins November 1st and summer begins May 1st, the report notes; 
The greater frequency of low-price hours in this year and in the past two years mirrors the general trend of lower Ontario demand and also reflects the increase to Ontario baseload supply, or generation that is offered like baseload supply (i.e. generators with fixed price contracts per MWh delivered).

Baseload is difficult to define precisely in Ontario, as it has come to mean the electricity that the market needs to distribute because it is pre-purchased, regardless of demand.  That generally includes nuclear units, a significant share of hydro generation capacity,  a variety of, mainly natural gas, non-utility generators (NUGs), and generators contracted by the Ontario Power Authority (OPA) where the contract requires the grid to take all output (primarily wind and solar supply).   Table 2.8 of the MSP Report (page 103) demonstrates the supply/demand relationship when the HOEP drops below $20/MWh.  I've recreated much of that table, from existing data I've collected from available IESO sources; adding columns for wind data, and correcting a mistake in the April data on the original MSP Report.
Year Month Number of Low-Price Hours Ontario Demand Net Exports Ontario Demand Plus Net Exports Wind Production Wind Capacity Factor Corrected MSP Excess Low-Priced Supply MSP Ontario Demand Plus Net Exports Corrected MSP Total Supply
2010 11 75 13,493 1,280 14,773 824 67% 1,525 14,788 16,313
2010 12 62 14,522 2,085 16,607 720 56% 590 16,692 17,282
2011 01 73 14,683 2,024 16,707 713 54% 574 16,877 17,451
2011 02 27 15,769 1,002 16,770 995 71% 477 16,779 17,256
2011 03 67 14,583 1,146 15,730 753 54% 355 15,745 16,100
2011 04 211 13,550 1,473 15,023 722 52% 656 15,072 15,728


515 14,433 1,502 15,935 788 59% 696 15,992 16,688


Presumably the “excess low-priced supply” was either curtailed by steam bypass (primarily at Bruce); by taking nuclear reactors, or NUG suppliers, off-line; or, just as likely, by allowing water to flow freely instead of diverting it through hydroelectric turbines (the tools available to the IESO are shown here).  The MSP Report notes that frequently the ability to curtail wind production would eliminate some of the negative, and low, pricing.  What caught my attention here was the high wind production during the low-priced hours.  It appears that during low-price hours the recently contracted wind production was slightly higher than the low-priced supply being curtailed.  
I queried IESO data by grouping on Hourly Ontario Energy Price (HOEP) ranges, and the results demonstrate some interesting characteristics of Ontario's dysfunctional market.  As expected, low price periods feature high wind output, and high price periods don't.  

Wind is particularly problematic due to its erratic intermittent character, but it's really the proportion of supply that the market is required to take, in scale to the overall market, that primarily determines the HOEP.  Theoretically, a healthy market features a uniform price which is set by the last unit purchased.  That price can only be meaninggully set where there is price competition, among suppliers.  In Ontario market, the HOEP price is meaningless to the contracted generation - which is mostly referred to as "baseload" here.  Adding to the confusion, some supply that is not run constantly, or on a must-take contractual basis, also has set prices; Ontario Power Generation (OPG) has regulated hydro assets meant to balance the grid and meet ramping demands throughout the day.  I am grouping the data by baseload generation as a percentage of Ontario's demand, not inclusive of all hydroelectric output. That makes my measurements conservative, and the data shows prices dropping, and net exports increasing, at slightly above 85% baseload to demand.  As baseload exceeds 100% of demand, we expect the price to be low, or negative (depending on export markets) - these situations are known as Surplus Baseload Generation (SBG) periods to the system operator that predicts upcoming SBG conditions, in order to plan supply curtailment actions.  


The data for the OEB winter period of 2011 (November 2010 – April 2011) indicates the expected result when baseload is over 100% of Ontario demand.   There is a surprising result at the other end, as net exports rise, probably as prices rise above the cost of fuels Ontario's suppliers found the capacity to fill export demand.  The elevated net exports, when baseload was low and price higher, was not apparent in 2011's summer, indicating the capacity required to meet the peak demand of the summer is utilized to generate electricity for exports in the winter.  Throughout the year, there is a consistent, inverse, relationship between low price and high baseload, as a percentage of Ontario demand.   As the baseload:demand ratio moves about 90%, dumping, at depressed prices, begins.  The higher this ratio, the lower the price and higher the net exports.

With the relationship established, we can now forecast what is most likely to occur with electricity market pricing in Ontario.  The data for the following  graph I developed for an earlier project, "The Real Costs of Wind Generation in Ontario."  The historical figures demonstrate Ontario's move from net importer,  prior to 2006, to large net exporter now.  This trend coincides, as one should expect, with a decline in the market, HOEP, rate (from, approximately, $72.14 in 2005 to $32.60 thus far in 2011).

The number of hours where baseload exceeds Ontario demand is set to rise rapidly through 2014, when refurbishment work on nuclear reactors will temporarily slow the growth (in this model).  However, the continued growth of wind that is currently foreseen will have a disproportionate impact on seasonal excess supply frequency.  Because wind performs poorly in summer's heat (average capacity factors in the low teens), removing nuclear capacity will temporarily reduce hours where baseload exceeds demand – but the higher capacity factors of the shoulder seasons, and cooler periods, means that surplus baseload generation will escalate rapidly with increasing wind capacity even with a lower nuclear contribution in Ontario's supply mix.   It will simply move from primarily a problem from May-October (the OEB's summer period, and also the period of most SBG periods in 2009), to a year round issue.


None of this information is new to those of us familiar with the data.  My previous forecasting project concluded we are moving towards a supply mix where approximately a third of all wind output will need to be curtailed, dumped on export markets, or displace baseload hydro and/or nuclear, a conclusion reached earlier in the year by Aegent EnergyAdvisors.

The Market Surveillance Panel's Report urges the IESO to speed up the process designed to make, “wind generators dispatchable,” which is a solution to the market pricing, but a solution that is to pay suppliers without accepting supply from them.  The IESO's process, SE-91, seems to have a worrisome focus, albeit one determined by government policy.  Central forecasting may be a tool to determine how much to pay suppliers when their production is curtailed due to a surplus of supply – but there seems less interest in making the forecast accurate with the lead time, and frequency, required by the market design.  Most of the 'stakeholders' are from the renewable energy industry, and as such wouldn't have any foundation of knowledge in the requirements of a healthy market.

That won't be much of an impediment in Ontario, where there isn't a healthy market, and none seems likely in the foreseeable future.


Thursday, 17 November 2011

Reviewing Ontario's Feed-In Tariff: Part 2


The current feed-in tariff (FiT) review in Ontario provides an excuse to explore some larger topics - like markets, efficiency, climate change and polices intended to lower emissions. FiT programs will drive up the price of electricity which threatens to reduce the movement of energy consumption towards increased use of electricity - a necessity in the eyes of may if overall carbon emissions are to be meaningfully reduced. FiTs, especially those offered with protectionist requirements, discourage trade in electricity, and that, in turn, further reduces efficiency and, therefore, affordability.

The premise that increased electricity is necessary for a low-carbon world has been repeatedly emphasized this year, including in reports on reducing greenhouse gas (GHG) emissions in California, and even more recently in a report, “Scottish Energy 2020?”, put out by the Institution of Mechanical Engineers.  That report noted, “Electricity is actually projected to be the smallest component of Scotland’s energy demand (heat and transport energy being greater)...”  

That sent me to the figures at the back of Part 3 of Canada’s latest (2009) National Inventory Report, to calculate per capita emissions for 3 categories with large residential components.   The resulting graphic shows per capita emissions in Ontario and Quebec (‘Electricity and Heat’ is almost entirely electricity in both provinces, as the ‘heat’ referred to here is primarily the H in CHP - which is essentially absent in these provinces).  I’ve shown emissions from light vehicles, including light trucks.   Most are aware of Quebec’s hydroelectric capacity, but I’m not sure many understand the implications of heating with electricity.  In Ontario, 2011 is likely to see more emissions from heating than from all electricity generation (and both will be dwarfed by the use of light vehicles).


The use of electricity for heat has enormous implications for electricity planning.   One important characteristic in planning electricity systems is peak demand.  I’ve taken information available on projected 2012 monthly peaks in Quebec, and graphed it with the result of queries on data taken from Ontario’s Independent Electricity System Operator (IESO).


There’s a couple of immediate implications.  Quebec could have capacity available to help Ontario meet peak demand, in the summer, and Ontario will have excess capacity quite often, even before the addition of intermittent supply due to the FIT program.  Additional intertie capability came online late in 2010, and the relationship during Ontario’s peak demand, summer, period, showed the expected relationship.  Ontario sends excess generation to Quebec overnight, and Quebec’s hydro reservoirs reciprocate in meeting the morning surge in demand (and also can be rapidly cut back as demand drops as people go to bed).  While Ontario demand was peaking, on the afternoon of July 21st, Ontario was importing over 2000MW an hour from Quebec.  This doesn’t address why Quebec would want to commit to maintaining this relationship, which is a point I’ll return to.


Most days the relationship makes sense primarily in ramping up with Quebec hydro to meet the morning jump in demand, and quick removal of imported Quebec supply at night.  During the bulk of the daytime hours Ontario generally just moves the Quebec supply along to other jurisdictions - where the export curve dwarfs the imports from Quebec.  In the end, the current relationship between Ontario and Quebec’s electricity systems reflects both are large exporters.


It has been reported the Ontario’s FiT program is a direct result of Dr. Hermann Scheer advocating Ontario’s Premier copy the German FIT program.  Germany’s experience with their FiT program, over the first 7 years of the previous decade, did indicate the problems Ontario would see - in including increasing periods of negative pricing, and escalaing exports at depressed prices.  Dr. Scheer (political science) was, reportedly ,introduced to Ontario’s Premier, in June 2008, by Dr. David Suzuki (zoology).  Nine months prior to the meeting in Ontario, the 12-month rolling total of Germany’s generation from Industrial wind turbines (IWT’s) had peaked at a level it has not since returned to.   


Ontario’s most popular newspaper is the Liberal party friendly Toronto Star.  Three days before Ontarians headed to the polls, the Star brazenly provided Jürgen Trittin, formerly Germany’s Federal Minister of the Environment, Nature Conservation and Nuclear Safety 91998-2005), editorial space to intervene in Ontario’s election.  Tritten’s lecture ended with “Ontario is on the right path. Now it must stay the course.”    According to Der Speigel, that course involves politicians enriching allies: “Few people in the hinterlands are familiar with the name Aloys Wobben, but the founder of the wind power company Enercon is now a multibillionaire and one of Germany's richest people. Thanks to former Environment Minister Jürgen Trittin, companies that got their start in garages were able to earn millions upon millions during the years when Germany was run by a Social Democratic Party (SPD) and Green Party coalition government.....” .  Germany’s experience indicate they understood that increased contributions from wind must displace baseload (constant output) sources.  I’ve explored the reasons for that previously, but it’s important to note Germany; having found wind production was primarily driving exports, is now finding the same limitations are true of of the solar capacity which has seen enormous growth since wind output started dropping. Bavaria now has periods where solar output can meet all demand, and yet on average solar produces only 8% of their supply.


Electricity systems have a minimum, average and maximum - and without heating those approximate a 1:1.5:2 relationship.  So 1000MW of solar could supply 1000MW of demand, but is likely to average only 150MW out of an average of 1500MW.  Of course, it could also produce no output when demand calls for it. During winter peak demand periods in northern jurisdictions, it doesn’t.  Regardless, solar, at an annual capacity factor of 15%, could only provide 10% of all generation before output would, at times, require curtailment, or storage.  The same issues exist for wind.  If you have 1000MW of baseload (ie. nuclear), the system is immediately inefficient.  
France/Germany trends Similar to Quebec/Ontario's
It appears the FIT regime lobbyist brought to Ontario is designed to encourage capacity that discourages nuclear baseload.


The cost of the actual FIT contracts are noticeable, but the additional costs borne by the system, due to the introduction of intermittent sources, are also large components of price increases/efficiency decreases.  Two issues deserve special attention.  The first deals with  the most efficient way to reduce emissions from generation, and the second is ensuring generation capacity can meet demand at all times.


I demonstrated, with US data, two known ways to reduce emissions from electricity are to reduce the use of electricity, or to generate more energy with nuclear power.  Recently, PwC (PricewaterhouseCoopers LLP), released a “Counting the cost of carbon; Low carbon economy index 2011,” showing the lack of action in lowering the carbon intensities of the world’s nations.  That report noted two extended periods of time where jurisdiction did have some success in lowering the carbon intensity of their economies: “France decarbonised at 4.2% during the 1980s by increasing the share of nuclear in the energy mix from 7% to 33%” and; “The UK decarbonised at 3.0% in the 1990s during a ‘dash’ for gas power generation that replaced coal generation...”  The second of these solutions seems like it might run up against a supply issue, and just last week Greenpeace was responding to a BBC program indicating the coming price hikes, due to offshore wind programs, with a release noting natural gas pricing was increasing the UK’s energy bills far more than electricity.  Regardless, the presumption that intermittent, renewable, supply, will reduce emissions remains a promise for the future - one which the PwC report indicates will never arrive.  

If it does, it seems increasingly likely renewables will need to be better integrated into supply, either with advancements in energy storage technologies, or better integration with existing resources.  Specifically, new gas turbines, made for balancing the output of intermittent sources, are being developed, and grid interties with load-balancing capable hydroelectric rich jurisdictions. For subsidy programs, the indication is that subsidizing intermittent sources can only lead to subsidizing technologies to support them - some of which, such as natural gas-fired generation, will produce carbon emissions.


Estimated from IESO Data (Years Start Nov. 1)
Wind and solar generators have no expectations of being productive during peak demand (solar does for the summer peak, but as we’ve seen, summer peaking is true only if a system heats with gas).   In a self-contained market, this generally means natural gas will be used to provide peaking, unless the market is blessed with variable hydroelectric potential (requiring larger reservoirs for storing energy for longer periods of time).  What Ontario has done, in part due to the desire to eliminate coal, is to contract Combined Cycle Gas Turbine (CCGT) capacity in order to get natural gas generation built.  Coupled with essentially writing off the coal plants, this has helped to keep the Hourly Ontario Energy Price (HOEP) depressed.  Because the ‘plant’ is already paid for through the Net Revenue Requirement agreements, and because coal and/or natural gas are the marginal producers, the price is set just above the cost of the fuel (see Figure 1-25 on page 84 of this .pdf)  Because the marginal source is impacted this way, we’ve also seen a contraction of the price variance between peak, and off-peak, periods, while spending billions to meter supply to charge based on variable pricing between peak, and off-peak, periods. Our generation policies are the opposite of our demand management policies.


A more market-oriented approach to ensuring capacity is through the development of capacity markets, where suppliers bid on having capacity available (see here).  Germany, having decided to solve the oversupply issues during windy and/or sunny periods by axing nuclear baseload supply, is considering capacity markets (see here).  Market forces in Germany, and market/political forces elsewhere, argue powerfully against the introduction of capacity markets.  These people argue the market is best suited to find the most efficient solution to demand issues.  Ontario would seem to be the perfect example of how not to operate a market, in that peak periods are increasingly cheaper, procurement policies are unrelated to demand management policies, and the resulting excess production is dumped on export markets at less than half the price Ontarians pay for the same commodity.  
A persuasive argument against capacity markets is made by Norway’s primarily hydroelectric powerhouse, Statkraft, in “Position of Capacity markets for the German Power Market.” The submission should be required reading at Hydro-Quebec (as should this study, from Poyry,).  Quebec, like Norway, stands to benefit enormously from expanded generation from renewables - which from the business standpoint of owners of hydro and gas would be better described as ‘unreliables.’   Unfortunately Quebec seems unwilling to thrust itself into championing the market it could dominate (if low carbon production was widely valued). Ironically, both Statkraft and Hydro-Quebec are controlled by their respective governments (as are most major hydroelectric generators)


American markets are being held at low levels by the low price of natural gas, which is making the marginal supply for electricity cheap (although the New England markets offer much higher rates than Ontario does).  The natural gas revolution is an outcome of the development of hydraulic fracturing (fracking), but economic theory had already predicted there would be energy supply developed.  In 1974, at the height of the Oil Crisis, the Economist magazine printed an editorial titled, “The Coming Glut of Energy.”  The basic premise is that, for energy, the elasticity of substitution is greater than the elasticity of demand.  Vaclav Smil’s lecture at the Equinox Summit touches on a similar theme, in discussing the term “running out” in terms of energy transitions (around the 12:45 mark).    Running out is generally a poor description of diminishing returns on extracting a resource using existing methods.  That is likely to lead to substitution of either the method (to extract previously inaccessible supply), or the resource.  Unfortunately, economic theory lacks the simplicity politically established icons, such as a wind turbine, provide.

Cranking up production of natural gas is a questionable solution to reducing carbon emissions. It is likely that replacement technologies would emerge, and offer greater value, in a scenario encouraging the removal of an incumbent technology instead of by choosing replacement technologies to subsidize. Both carbon trading, and carbon taxation are likely far superior to feed-in tariffs.

Feed-in tariffs reduce a large number of possibilities to a select group of chosen futures.  There is little reason to believe FiT designers will prove more accurate prognosticators than any other fortune teller.